
In this article, I describe how to use Data Flow Diagrams in threat modeling.
Data Flow Diagrams (or DFDs for short) are used extensively in threat modeling. In fact, they are used in many different types of threat modeling methods, such as STRIDE and PASTA threat modeling.
Data Flow Diagrams provide readers and threat modelers with a simple technical diagram, to depict flows of data and interactions between key components of an application or IT system.
The power of Data Flow Diagrams is their simplicity. Limited component types and diagram symbols mean that an entire team can quickly and easily understand it.
Note that Microsoft has helpful online training in the use of DFDs within threat modeling.
You can also apply Data Flow Diagramming within our threat modeling tool.
Why use Data Flow Diagrams (DFDs) in Threat Modeling
Data Flow Diagrams have the following advantages when used in threat modeling:
- Having (and thus understanding) a high-level overview of the most important components, connectors, and actors.
- Having (and thus understanding) a high-level overview of the data (or communication) flows between components.
- Not zooming into too much technical detail (compared to architectural diagrams), meaning they are readable for non-technical people.
- A simple diagram that can be used to communicate ideas between team members.
- A diagram that can be used for other steps in the threat modeling process.
The main reason to use a Data Flow Diagram in threat modeling is to have a simple common understanding of the main components and communication flows within threat modeling, and for all team members.
What does a Data Flow Diagram Consist of?
Data Flow Diagrams typically have five types of components:
- Data Flow:
- Consists of an arrow symbol.
- Depicts data flowing from the source to the destination component. Data can also flow two ways, which is shown by two arrows (one on either side of the arrow). Data Flows should only include data moving from one component to another and not include data transformation or alteration.
- Data Store:
- Consists of two lines, or a database symbol (you can choose from both options).
- Depicts a storage location of information used by the system. This is typically a database, a file, or some other data storage solution. Data going to the Data Store typically means data being saved. Data going from the Data Store typically means data being read.
- Process:
- Consists of a circle, or a rounded rectangle.
- Depicts applications or processes that apply logic and/or change data. The Process is typically where important logic or reasoning occurs, and is thus the ‘core’ or ‘center’ of the Data Flow Diagram.
- Interactor:
- Consists of a rectangle.
- Depicts an endpoint (person or system) that interacts with or uses the process. An Interactor is external to the system in scope. An Interactor can be an individual person or system, but it can also be an entity such as a ‘Customer’, or ‘Third Party.
- Trust Boundary:
- Consists of a dotted line, multiple dotted lines, or a dotted rectangle.
- Depicts a boundary between trust zones (i.e. the boundary between trusted and non-trusted zone). The Trust Boundary clearly shows what trust can imply for the boundary’s components. Trust is an important concept of threat modeling.

How to use Data Flow Diagrams in Threat Modeling – DFD Symbols
The above component types are the only component types that you should be using as part of Data Flow Diagrams in threat modeling. That’s because the simplicity of a Data Flow Diagram lies in using only these five component types.
However, you are free to use more if you feel that helps. It can work if your team is experienced in reading and interpreting Data Flow Diagrams and/or have a good technical understanding of the system in the scope of threat modeling.
How to use Data Flow Diagrams in Threat Modeling
Note that the following steps are a suggestion of order, you may deviate from the order. There isn’t a single best way of drawing a Data Flow Diagram.
Step 1: Understanding Processes (and/or application components), Data Flows (Communications), and Actors.
Before creating the Data Flow Diagram as part of the threat model, make sure you and your team have a good understanding of the application or IT system in scope, and how it works, etc. Different team members may have different points of view and a different understanding of the application.
Step 2: Draw the main Processes (application components, or functions at the heart of the application in scope).
Start with the main components that actually ‘DO’ something within your application, IT system or solution that is in scope of the threat modeling session. Add them to your diagram as Processes (a circle or a rounded rectangle).
A few examples include:
- A front-end application, which is used by customers to interact with components in the back-end.
- A back-end application, which is controlled by the front-end application, but also serves content via the API, and has external connectors, etc.
- A backup solution, which takes data from a main system and converts it to a backup file (to be sent to a Data Store).
- A web app within an Azure environment.
- A service from AWS that processes data (i.e., a Lambda function).
- An Identity & Access Management solution that connects to your application.
Step 3: Draw the Interactors.
Once the Processes (or application components) have been defined, you should add the main Interactors. These are the people, entities or systems that will interact with your application or IT system. These are often external people or entities (for example, a customer or a third party), but it can also be internal (for example, an internal user, or an internal developer).
A few examples include:
- A customer (typically accessing an application via the internet).
- An external service that connects with the application or IT system.
- An external backup service connecting with the application or IT system.
- An internal employee that works on the application or IT system.
Step 4: Draw the Data Stores.
Most applications or IT systems need to store data. Typically this is in a database, but it could be disk storage or some other kind of storage.
You should draw the Data Stores that are applicable to your application.
Step 5: Draw the Trust Boundaries.
The main Processes, the Interactors and the Data Stores must be placed in Trust Boundaries.
Typically you would have Trust Boundaries for 1) the Internet or other public networks, which are untrusted, 2) Internal network, which is trusted, 3) other internal and segmented networks, or 4) other logical Trust Boundaries which are not networking related, for example, a trusted or non-trusted part of a computer, a trusted part of a Blockchain process, etc.
The point is that in this step, you should make sure all components are placed (or tagged) in a Trust Boundary.
Step 6: Draw the Connectors.
In the last step, make sure to draw the connectors between the Processes, Interactors and Data Stores. Only connect components that communicate with each other.
Make sure that the arrows correctly show the flow of data. A Connector can also depict data flowing in both directions.
Examples of Data Flow Diagrams in Threat Modeling
Data Flow Diagram in Threat Modeling Example 1
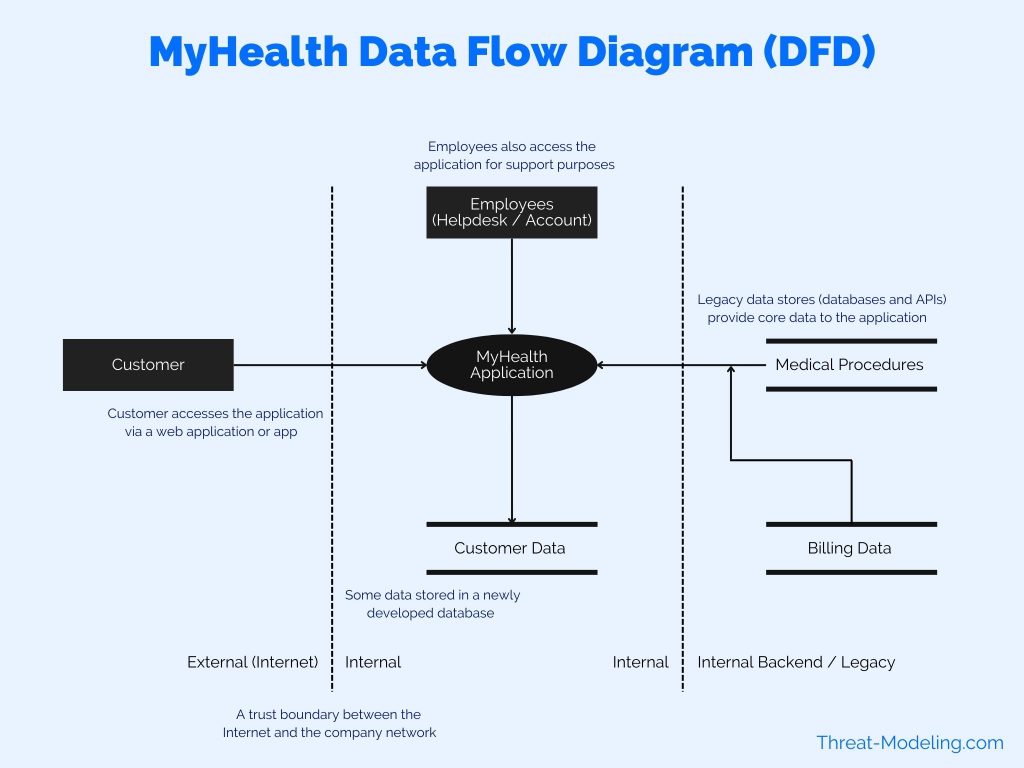
This Data Flow Diagram example is from the MyHealth example threat model.
This example shows that the Customer is accessing the MyHealth Application from the Internet. The MyHealth application is also accessed by employees, but from an internal location (and not the internet). The MyHealth application uses a data store with customer data. Further, there are legacy data stores in the backend network environment.
Data Flow Diagram in Threat Modeling Example 2
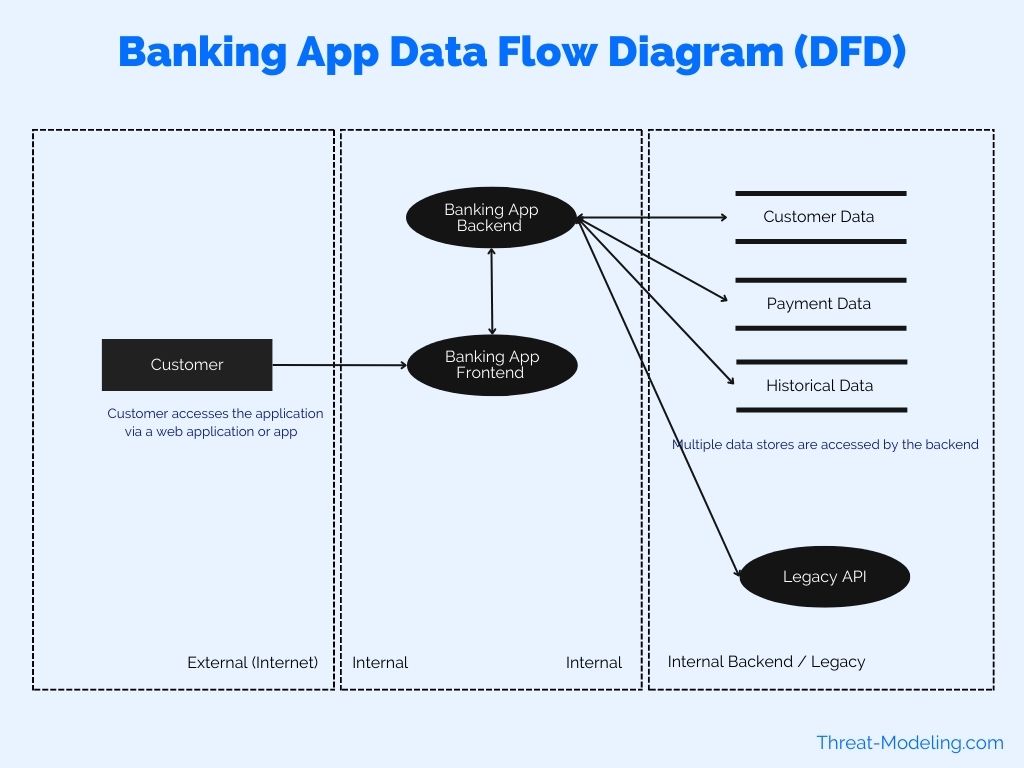
This example shows a banking app connecting with legacy systems within the company.
In this example I use rectangle with dotted lines to show Trust Boundaries (instead of just lines in the previous example). The banking app has a frontend and a backend (to represent that this is technically the case). The banking backend connects with many legacy data stores and a legacy API.
Data Flow Diagram in Threat Modeling Example 3
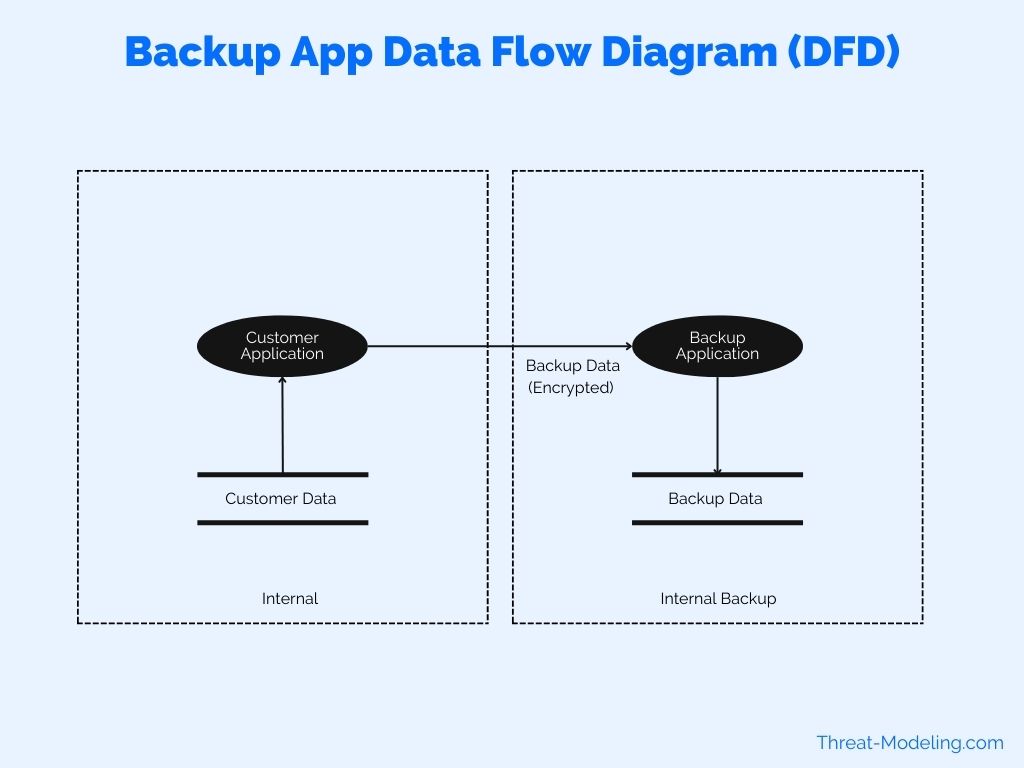
This example shows a backup application, and how it connects and receives data from a customer application.
This provides a very high over of the data flows in a backup scenario. Next steps in this Data Flow Diagram can consist of providing more detailed explanations of data flows. For example, when does the data copy from the customer application to the backup application, who has access to this, etc.
Conclusion on How to use Data Flow Diagrams in Threat Modeling
This article highlights how to use Data Flow Diagrams in threat modeling. As part of the how-to understanding, I described the symbols used in a Data Flow Diagram, and the steps needed to create a diagram (which can be used for threat modeling purposes).
Data Flow Diagrams can provide users and team members with a quick understanding of how an application works, how the data moves around, and how the application communicates with other key applications and processes.
Data Flows Diagrams are critical in understanding STRIDE threats, and in performing PASTA threat modeling (and understanding PASTA threats).